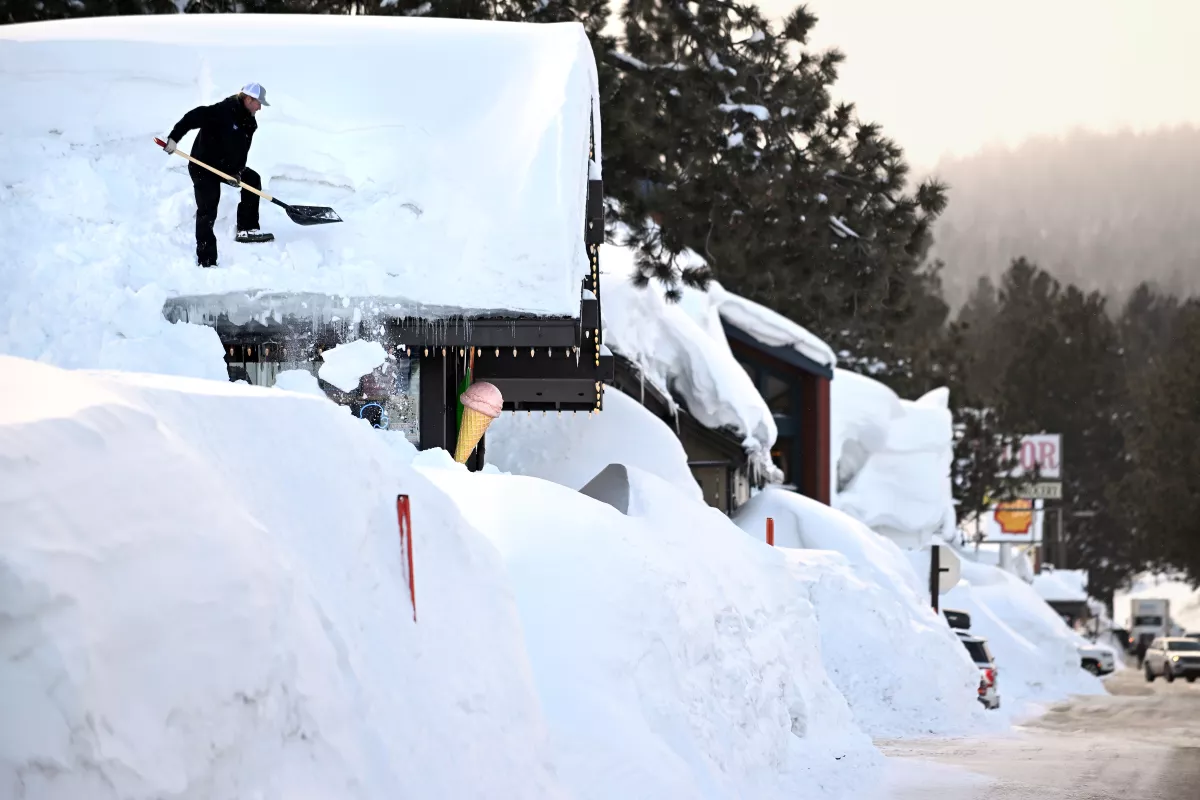
California’s Snowpack is Now One of the Largest Ever, Bringing Drought Relief, Flooding Concerns
SACRAMENTO, Calif. – The Department of Water Resources (DWR) today conducted the fourth snow survey of the season at Phillips Station. The manual survey recorded 126.5 inches of snow depth and a snow water equivalent of 54 inches, which is 221 percent of average for this location on April 3. The snow water equivalent measures the amount of water contained in the snowpack and is a key component of DWR’s water supply forecast. DWR’s electronic readings from 130 snow sensors placed throughout the state indicate the statewide snowpack’s snow water equivalent is 61.1 inches, or 237 percent of average for this date.
“This year’s severe storms and flooding is the latest example that California’s climate is becoming more extreme,” said DWR Director Karla Nemeth. “After the driest three years on record and devastating drought impacts to communities across the state, DWR has rapidly shifted to flood response and forecasting for the upcoming snowmelt. We have provided flood assistance to many communities who just a few months ago were facing severe drought impacts.”
Just as the drought years demonstrated that California’s water system is facing new climate challenges, this year is showing how the state’s flood infrastructure will continue to face climate-driven challenges for moving and storing as much of these flood water as possible.
This year’s April 1 result from the statewide snow sensor network is higher than any other reading since the snow sensor network was established in the mid-1980s. Before the network was established, the 1983 April 1 statewide summary from manual snow course measurements was 227 percent of average. The 1952 April 1 statewide summary for snow course measurements was 237 percent of average.
“This year’s result will go down as one of the largest snowpack years on record in California,” said Sean de Guzman, manager of DWR’s Snow Surveys and Water Supply Forecasting Unit. “While 1952’s snow course measurements showed a similar result, there were fewer snow courses at that time, making it difficult to compare to today’s results. Because additional snow courses were added over the years, it is difficult to compare results accurately across the decades with precision, but this year’s snowpack is definitely one of the biggest the state has seen since the 1950s.”
For California’s snow course measurements, only 1952, 1969 and 1983 recorded statewide results above 200 percent of the April 1 average. While above average across the state this year, snowpack varies considerably by region. The Southern Sierra snowpack is currently 300 percent of its April 1 average and the Central Sierra is at 237 percent of its April 1 average. However, the critical Northern Sierra, where the state’s largest surface water reservoirs are located, is at 192 percent of its April 1 average.
The size and distribution of this year’s snowpack is also posing severe flood risk to areas of the state, especially the Southern San Joaquin Valley. DWR’s State-Federal Flood Operations Center (FOC) is supporting emergency response in the Tulare Lake Basin and Lower San Joaquin River by providing flood fight specialists to support ongoing flood response activities and by providing longer-term advanced planning activities. The FOC and DWR’s Snow Surveys and Water Supply Forecasting Unit are helping local agencies plan for the spring snowmelt season by providing hydraulic and hydrologic modeling and snowmelt forecasts specific to the Tulare Lake Basin that are informed by DWR’s snowmelt forecasting tools, including Airborne Snow Observatory (ASO) surveys.
Storms this year have caused impacts across the state including flooding in the community of Pajaro and communities in Sacramento, Tulare, and Merced counties. The FOC has helped Californians by providing over 1.4 million sandbags, over 1 million square feet of plastic sheeting, and over 9,000 feet of reinforcing muscle wall, across the state since January.
On March 24, DWR announced an increase in the forecasted State Water Project (SWP) deliveries to 75 percent, up from 35 percent announced in February, due to the improvement in the state’s water supplies. Governor Newsom has rolled back some drought emergency provisions that are no longer needed due to improved water conditions, while maintaining other measures that continue building up long-term water resilience and that support regions and communities still facing water supply challenges.
While winter storms have helped the snowpack and reservoirs, groundwater basins are much slower to recover. Many rural areas are still experiencing water supply challenges, especially communities that rely on groundwater supplies which have been depleted due to prolonged drought. Long-term drought conditions in the Colorado River Basin will also continue to impact the water supply for millions of Californians. The state continues to encourage Californians to make water conservation a way of life as more swings between wet and dry conditions will continue in the future.
DWR conducts five media-oriented snow surveys at Phillips Station each winter near the first of each month, January through April and, if necessary, May. Given the size of this year’s snowpack with more snow in the forecast, DWR anticipates conducting a May snow survey at Phillips Station. That is tentatively scheduled for May 1. source
One of California’s biggest snowpacks ever
The statewide snowpack is “one of the largest snowpack years on record in California,” officials with the Department of Water Resources (DWR) said Monday.
The latest readings from the DWR’s network of electronic sensors are the highest since the system was established.
- Monday’s manual measurement at Phillips Station — in which officials plunge an aluminum tube deep in the snow, put the snow depth at 126.5 inches, which is 221% of average. (This is typically done on the first day of each winter month but April’s moved since the 1st was a Saturday.)
Why it matters: The record wet winter that brought in so much snow also means the Bay Area is no longer in a drought. But it’s raised concerns about spring flooding.
What they’re saying: Snowpack in the Tuolumne River watershed, which feeds San Francisco, “is within the top 5 historic years,” DWR spokesperson Jason Ince emailed Axios SF.
- But it can’t be crowned the biggest ever, he says, because “it is difficult to directly compare years across the decades due to changes in the number of survey sites over time.”
Of note: Seventeen atmospheric rivers have struck California since December, according to Scripps Institution of Oceanography. And climate change is adding even more moisture to them, per Axios’ Andrew Freedman. source
With storm after storm of heavy snowfall in the Sierra, there are several ways to measure the results for California.
This year has been record-setting on many levels with it being the second-greatest amount of snow falling so far in a season, the second-greatest snow water content locked up in the high country, and the eighth-greatest amount of snow depth ever recorded at Donner Summit. source
After a remarkable series of winter storms, California water officials reported Monday in their April snow survey the Sierra snowpack is among the largest on record, dating back to the 1950s.
The state’s Department of Water Resources surveys mountain snowpack once a month through the winter, and the April survey is usually the most consequential. Officials use the measurement to forecast the state’s water resources for the rest of the year.
Last year’s survey was pitifully low. Water officials had just a small patch of shallow snow to measure after a disappointing winter. The snow depth on April 2 was just 2.5 inches – part of a disastrous multiyear dry spell that triggered water cuts across the state.
But what a difference a year makes.
Twelve months later, the mountains are now loaded with white gold. South of Lake Tahoe at Phillips Station, as snowflakes fell from the surrounding hills, officials measured a snow depth of 126.5 inches and a snow water equivalent – how much liquid water the snow holds – of 54 inches.
Snowpack in the California Sierra is 221% of normal for this location at this time of year, officials at the Department of Water Resources said. Statewide, snowpack is averaging 237% compared to normal for the date – a significant boost after the back-to-back storms.
Sean de Guzman, snow survey manager for the state Department of Water Resources, said this is the “deepest snowpack” he has personally ever measured, noting that there have only been three other years when California snowpack has been greater than 200% of average in April.
“This year is going to join that list and be another year well above 200% of average,” de Guzman told journalists at a briefing Monday. “We still are waiting for more snow data and snow survey results to come in from our various cooperators and partners. But as of this morning, as of right now, it’s looking like this year, statewide snowpack will most likely be either the first- or second-biggest snowpack on record dating back to 1950.”


Snowpack in the Sierra is critical to the state’s water resources. The snow acts as a natural reservoir – melting into rivers and human-made reservoirs through the spring and summer – and accounts for 30% of California’s freshwater supply in an average year.
The state’s largest reservoirs, which were recently at critically low levels, have been replenished and are running higher than their historical averages.
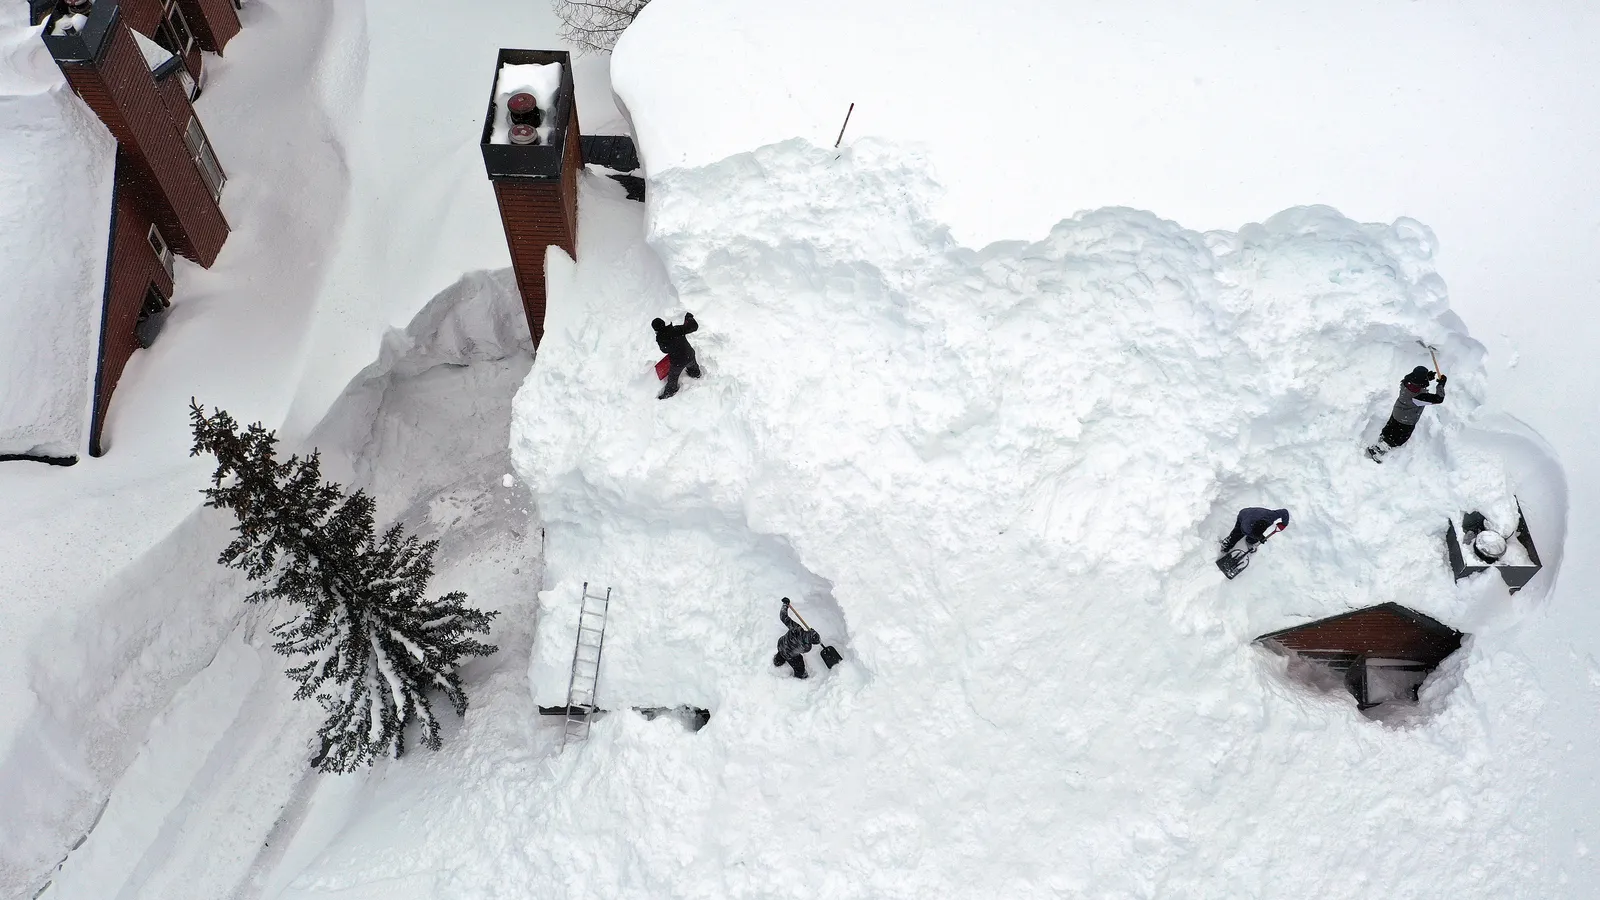
While the heavy rains caused widespread flash flooding and several feet of snow trapped residents in their homes in the higher elevations, the deluge of snow and rain has largely improved California soil moisture and streamflow levels after being gripped by the drought for so long.
California Gov. Gavin Newsom last month also announced the removal of some drought restrictions, while the Department of Water Resources said it will increase the amount of water deliveries to 75% of requested water supplies this year – up from the initial plan of only 5% last year.
“Even though we have this extraordinary snowpack, we know that the droughts are getting deeper and more frequent, and that means we have to use water efficiently no matter what are hydrologic conditions,” Department of Water Resources Director Karla Nemeth said. “And the governor has emphasized that as the path forward for California, and to make sure that we are resilient as an economy and for our environment that we all continue to use water wisely in the state.”
Measuring snow from a plane
To find out just how much snow the Sierra Nevada were buried under this winter, Airborne Snow Observatories Inc., which provides its data to California’s Department of Water Resources, flies over the range to gauge what’s fallen.
“We measure snowpack wall-to-wall over mountains from aircraft using lasers and spectrometers,” said Tom Painter, the company’s CEO. “From that information, we can then know the full distribution of how much water there is in a mountain snowpack and also how fast it’s going to melt. That’s allowed us then to change forecast errors from being pretty large to very small and really dramatically changed water management in the west.”
The planes fly for about six hours at a time, collecting different kinds of data through open portals in the belly of their planes, which they process and deliver within about 72 hours to help municipalities allocate water resources, generate hydroelectricity and meet environmental metrics.

“The scanning LIDAR is a fancy laser pointer, essentially, that sprays out laser pulses – about 500,000 pulses per second – flying along at 23,000 feet, and measures how long it takes for the laser pulse to go out, hit the surface and come back,” Painter said. “And we can use that information to then know the surface of the snow. Every square foot of mountain snow is touched by our lasers.”
The scientists then compare this data to when they’ve flown over the same area when there wasn’t any snow.
“The difference between those two is snow depth,” Painter explained. “Depth times density is equal to what’s called snow water equivalent, which is the most important water metric out there that allows civilization to exist in the Western US. It really is the mountain snowpack that drives all of this civilization.”
The year-to-year difference couldn’t be starker, Painter said, adding that this year, there will be snow in the Sierra into the summer.
Last year, the company ended its flyover season in late May; this year, they expect to be flying until August.


For the Tuolumne River Basin around Yosemite National Park – which supplies water to San Francisco and other Bay Area municipalities – imagery from last year this time is mostly dark blue: barely any snow. This year, the same area is swathed in orange, yellow and white, indicating snow depths of 10 to 20 feet.
On Mammoth Mountain in the eastern Sierra, about 60 feet of snow has fallen this year, breaking the old record set in 2010. And snow depths have reached more than 100 feet in some areas around Mammoth. The amount of snow is so profound that the resort has already announced that the ski season will last through the end of July this year.
“It’s fascinating to look at how the cliffs up on the upper mountain have really gotten buried and the gullies between them are filling in to where they just are kind of disappearing,” Painter noted, adding that he’s never seen Mammoth Mountain this covered.
A need for more drought-busting years
Despite all the rain and snow that has boosted reservoirs and allowed officials to lift some water restrictions, scientists still say drought concerns are a priority as climate change continues to impact California’s weather.
“The climate models had already been predicting what it is that we are seeing now, which is this hydroclimate whiplash where we’re going from really dry years to really wet years,” Painter said, adding that this whiplash is hard on water managers. “That means we could very well have a dry year next year. No one really knows.”
And as temperatures warm again as summer approaches, experts warn more flood threats lie ahead as the snow melts. California water officials said that after today, they plan to shift their focus “from snowpack building to snowpack melting,” and actively support emergency flood protection efforts.
“We’re now heading into another issue of increasing solar radiation and chances of warm nights and lack of refreeze, and that brings up snowmelt flooding concerns,” said Benjamin Hatchett, researcher at the Desert Research Institute. “That’s going to be something to think about as we move into the spring, summer with this colossal snowpack sitting above us.”

Hatchett also warns not to get “caught up in all these benefits,” and consider what all this water can mean for vegetation growth and wildfire fuel.
“As things start to dry out and get warmer, this is a good year to really think about what’s going to happen, what’s growing, and how can you deal with [the fuels] to reduce your fire risk in upcoming seasons,” Hatchett said.
Even with California’s historic snowpack this year, the state still pulls about a third of its water needs for the southern part of the state from the Colorado River Basin, where the snowfall totals improved this year, but were not as strong as the numbers posted in California.
The country’s largest reservoirs – Lake Powell and Lake Mead – in the Colorado River Basin are still hovering at or near-record-low levels following years of drought and overuse. But it could also improve in the coming months as snowpack levels rise in the region.
“That’s good news for a very strained and stressed system,” Hatchett said. “But we probably need five, six or maybe 10 more years of this to really make a big dent in the situation there, but this is much more encouraging to see.”
In California, water officials will head back to Phillips Station in May to measure more snow. The last time a May snow survey was necessary was in 2020, when the drought began.
The difference between last year and this year in California is significant. And although the state has all this excess of water now, climate experts warn that drought is always looming, especially in a drier, hotter and thirstier world.
Nemeth said there is much more work to be done to prepare and “adapt to our new climate realities.”
“You really get a sense of the extreme nature of our climate here in California,” she said. “There’s lots of fascinating research around the degree to which climate has been driving the intensity of these storms, but also the very rapid shift from very dry to very wet.”
“It is truly an extraordinary moment,” she said. “But we don’t get to stop and enjoy that for too long.”
| California/Nevada SNOTEL Snowpack Update Report | |||||||||||||||||||||||||||||||||||||||||||||||||||||||||||||||||||||||||||||||||||||||||||||||||||||||||||||||||||||||||||||||||||||||||||||||||||||||||||||||||||||||||||||||||||||||||||||||||||||||||||||||||||||||||||||||||||||||||||||||||||||||||||||||||||||||||||||||||||||||||||||||||||||||||||||||||||||||||||||||||||||||||||||||||||||||||||||||||||||||||||||||||||||||||||||||||||||||||||||||||||||||||||||||||||||||||||||||||||||||||||||||||||||||||||||||||||||||||||||||||||||||||||||||||||||||||||||||||||||||||||||||||||||||||||||||||||||||||||||||||||||||||||||||||||||||||||||||||||||||||||||||||||||||||||||||||||||||||||||||||||||||||||||||||||||||||||||||||||||||||||||||||||||||||||||||||||||||||||||||||||||||||||||||||||||||||||||||||||||||||||||||||||||||||||||||||||||||||||||||||||||||||||||||||||||||||||||||||||||||||||||||||||||||||||||||||||||||||||||||||||||||||||||||||||||||||||||||||||||||||||||||||||||||||||||||||||||||||||||||||||||||||||||||||||||||||||||||||||||||
|---|---|---|---|---|---|---|---|---|---|---|---|---|---|---|---|---|---|---|---|---|---|---|---|---|---|---|---|---|---|---|---|---|---|---|---|---|---|---|---|---|---|---|---|---|---|---|---|---|---|---|---|---|---|---|---|---|---|---|---|---|---|---|---|---|---|---|---|---|---|---|---|---|---|---|---|---|---|---|---|---|---|---|---|---|---|---|---|---|---|---|---|---|---|---|---|---|---|---|---|---|---|---|---|---|---|---|---|---|---|---|---|---|---|---|---|---|---|---|---|---|---|---|---|---|---|---|---|---|---|---|---|---|---|---|---|---|---|---|---|---|---|---|---|---|---|---|---|---|---|---|---|---|---|---|---|---|---|---|---|---|---|---|---|---|---|---|---|---|---|---|---|---|---|---|---|---|---|---|---|---|---|---|---|---|---|---|---|---|---|---|---|---|---|---|---|---|---|---|---|---|---|---|---|---|---|---|---|---|---|---|---|---|---|---|---|---|---|---|---|---|---|---|---|---|---|---|---|---|---|---|---|---|---|---|---|---|---|---|---|---|---|---|---|---|---|---|---|---|---|---|---|---|---|---|---|---|---|---|---|---|---|---|---|---|---|---|---|---|---|---|---|---|---|---|---|---|---|---|---|---|---|---|---|---|---|---|---|---|---|---|---|---|---|---|---|---|---|---|---|---|---|---|---|---|---|---|---|---|---|---|---|---|---|---|---|---|---|---|---|---|---|---|---|---|---|---|---|---|---|---|---|---|---|---|---|---|---|---|---|---|---|---|---|---|---|---|---|---|---|---|---|---|---|---|---|---|---|---|---|---|---|---|---|---|---|---|---|---|---|---|---|---|---|---|---|---|---|---|---|---|---|---|---|---|---|---|---|---|---|---|---|---|---|---|---|---|---|---|---|---|---|---|---|---|---|---|---|---|---|---|---|---|---|---|---|---|---|---|---|---|---|---|---|---|---|---|---|---|---|---|---|---|---|---|---|---|---|---|---|---|---|---|---|---|---|---|---|---|---|---|---|---|---|---|---|---|---|---|---|---|---|---|---|---|---|---|---|---|---|---|---|---|---|---|---|---|---|---|---|---|---|---|---|---|---|---|---|---|---|---|---|---|---|---|---|---|---|---|---|---|---|---|---|---|---|---|---|---|---|---|---|---|---|---|---|---|---|---|---|---|---|---|---|---|---|---|---|---|---|---|---|---|---|---|---|---|---|---|---|---|---|---|---|---|---|---|---|---|---|---|---|---|---|---|---|---|---|---|---|---|---|---|---|---|---|---|---|---|---|---|---|---|---|---|---|---|---|---|---|---|---|---|---|---|---|---|---|---|---|---|---|---|---|---|---|---|---|---|---|---|---|---|---|---|---|---|---|---|---|---|---|---|---|---|---|---|---|---|---|---|---|---|---|---|---|---|---|---|---|---|---|---|---|---|---|---|---|---|---|---|---|---|---|---|---|---|---|---|---|---|---|---|---|---|---|---|---|---|---|---|---|---|---|---|---|---|---|---|---|---|---|---|---|---|---|---|---|---|---|---|---|---|---|---|---|---|---|---|---|---|---|---|---|---|---|---|---|---|---|---|---|---|---|---|---|---|---|---|---|---|---|---|---|---|---|---|---|---|---|---|---|---|---|---|---|---|---|---|---|---|---|---|---|---|---|---|---|---|---|---|---|---|---|---|---|---|---|---|---|---|---|---|---|---|---|---|---|---|---|---|---|---|---|---|---|---|---|---|---|---|---|---|---|---|---|---|---|---|---|---|---|---|---|---|---|---|---|---|---|---|---|---|---|---|---|---|---|---|---|---|---|---|---|---|---|---|---|---|---|---|---|---|---|---|---|---|---|---|---|---|---|---|---|---|---|---|---|---|---|---|---|---|---|---|---|---|---|---|---|---|---|---|---|---|---|---|---|---|---|---|---|---|---|---|---|---|---|---|---|---|---|---|---|---|---|---|---|---|---|---|---|---|---|---|---|---|---|---|---|---|---|---|---|---|---|---|---|---|---|---|---|---|---|---|---|---|---|---|---|---|---|---|---|---|---|---|---|---|---|---|---|---|---|---|---|---|---|---|---|---|---|---|---|---|---|---|---|---|---|---|---|---|---|---|---|---|---|---|---|---|---|---|---|---|---|---|---|---|---|---|---|---|---|---|---|---|---|---|---|---|---|---|---|---|---|---|---|---|---|---|---|---|---|---|---|---|---|---|---|---|---|---|---|---|---|---|---|---|---|---|---|---|---|---|---|---|---|---|---|
| Based on Mountain Data from NRCS SNOTEL Sites | |||||||||||||||||||||||||||||||||||||||||||||||||||||||||||||||||||||||||||||||||||||||||||||||||||||||||||||||||||||||||||||||||||||||||||||||||||||||||||||||||||||||||||||||||||||||||||||||||||||||||||||||||||||||||||||||||||||||||||||||||||||||||||||||||||||||||||||||||||||||||||||||||||||||||||||||||||||||||||||||||||||||||||||||||||||||||||||||||||||||||||||||||||||||||||||||||||||||||||||||||||||||||||||||||||||||||||||||||||||||||||||||||||||||||||||||||||||||||||||||||||||||||||||||||||||||||||||||||||||||||||||||||||||||||||||||||||||||||||||||||||||||||||||||||||||||||||||||||||||||||||||||||||||||||||||||||||||||||||||||||||||||||||||||||||||||||||||||||||||||||||||||||||||||||||||||||||||||||||||||||||||||||||||||||||||||||||||||||||||||||||||||||||||||||||||||||||||||||||||||||||||||||||||||||||||||||||||||||||||||||||||||||||||||||||||||||||||||||||||||||||||||||||||||||||||||||||||||||||||||||||||||||||||||||||||||||||||||||||||||||||||||||||||||||||||||||||||||||||||||
| **Provisional data, subject to revision** | |||||||||||||||||||||||||||||||||||||||||||||||||||||||||||||||||||||||||||||||||||||||||||||||||||||||||||||||||||||||||||||||||||||||||||||||||||||||||||||||||||||||||||||||||||||||||||||||||||||||||||||||||||||||||||||||||||||||||||||||||||||||||||||||||||||||||||||||||||||||||||||||||||||||||||||||||||||||||||||||||||||||||||||||||||||||||||||||||||||||||||||||||||||||||||||||||||||||||||||||||||||||||||||||||||||||||||||||||||||||||||||||||||||||||||||||||||||||||||||||||||||||||||||||||||||||||||||||||||||||||||||||||||||||||||||||||||||||||||||||||||||||||||||||||||||||||||||||||||||||||||||||||||||||||||||||||||||||||||||||||||||||||||||||||||||||||||||||||||||||||||||||||||||||||||||||||||||||||||||||||||||||||||||||||||||||||||||||||||||||||||||||||||||||||||||||||||||||||||||||||||||||||||||||||||||||||||||||||||||||||||||||||||||||||||||||||||||||||||||||||||||||||||||||||||||||||||||||||||||||||||||||||||||||||||||||||||||||||||||||||||||||||||||||||||||||||||||||||||||||
| Data based on the first reading of the day (typically 00:00) for Wednesday, April 05, 2023 | |||||||||||||||||||||||||||||||||||||||||||||||||||||||||||||||||||||||||||||||||||||||||||||||||||||||||||||||||||||||||||||||||||||||||||||||||||||||||||||||||||||||||||||||||||||||||||||||||||||||||||||||||||||||||||||||||||||||||||||||||||||||||||||||||||||||||||||||||||||||||||||||||||||||||||||||||||||||||||||||||||||||||||||||||||||||||||||||||||||||||||||||||||||||||||||||||||||||||||||||||||||||||||||||||||||||||||||||||||||||||||||||||||||||||||||||||||||||||||||||||||||||||||||||||||||||||||||||||||||||||||||||||||||||||||||||||||||||||||||||||||||||||||||||||||||||||||||||||||||||||||||||||||||||||||||||||||||||||||||||||||||||||||||||||||||||||||||||||||||||||||||||||||||||||||||||||||||||||||||||||||||||||||||||||||||||||||||||||||||||||||||||||||||||||||||||||||||||||||||||||||||||||||||||||||||||||||||||||||||||||||||||||||||||||||||||||||||||||||||||||||||||||||||||||||||||||||||||||||||||||||||||||||||||||||||||||||||||||||||||||||||||||||||||||||||||||||||||||||||||
|
|||||||||||||||||||||||||||||||||||||||||||||||||||||||||||||||||||||||||||||||||||||||||||||||||||||||||||||||||||||||||||||||||||||||||||||||||||||||||||||||||||||||||||||||||||||||||||||||||||||||||||||||||||||||||||||||||||||||||||||||||||||||||||||||||||||||||||||||||||||||||||||||||||||||||||||||||||||||||||||||||||||||||||||||||||||||||||||||||||||||||||||||||||||||||||||||||||||||||||||||||||||||||||||||||||||||||||||||||||||||||||||||||||||||||||||||||||||||||||||||||||||||||||||||||||||||||||||||||||||||||||||||||||||||||||||||||||||||||||||||||||||||||||||||||||||||||||||||||||||||||||||||||||||||||||||||||||||||||||||||||||||||||||||||||||||||||||||||||||||||||||||||||||||||||||||||||||||||||||||||||||||||||||||||||||||||||||||||||||||||||||||||||||||||||||||||||||||||||||||||||||||||||||||||||||||||||||||||||||||||||||||||||||||||||||||||||||||||||||||||||||||||||||||||||||||||||||||||||||||||||||||||||||||||||||||||||||||||||||||||||||||||||||||||||||||||||||||||||||||||
Footnotes for median and average:
(##) = If less than 30 years are available, this value specifies the number of years used for the median and average calculations.
Sites with less than 10 years available do not have medians or averages.
The snow water equivalent percent of median (or average) represents the current snow water
equivalent found at selected SNOTEL sites in or near the basin compared to the median (or average) value
for those sites on this day.
The snow water equivalent percent of median (or average) peak represents the current
snow water equivalent at selected SNOTEL sites in or near the basin compared to the median (or average)
of the maximum seasonal values observed each water year for those sites.
Contact your state water supply staff for assistance.
Medians and averages are calculated for the period 1991-2020.
Provisional data, subject to revision.
* Site — Either: (a) the current value is missing; (b) the median or average for the day is not available or is zero; or (c) for snow water equivalent, the median or average for the day is less than 10% of the maximum median or average value for the year.
* Basin – More than half of the stations for a basin with normals report missing or invalid data.
The basin index is calculated as the sum of the valid current values divided by the sum of the corresponding medians or averages and the resulting fraction multiplied by 100.